Moving docs to be co-located with other docs + updating links. This has
the benefit of not including docs in engine content hash semantics.
2.6 KiB
iOS CPU Profiling
XCode (via Instruments) has a number of built in profiling tools that can easily be used with local or prebuilt engines. This document is focused on creating Flame Graphs. These are not part of XCode but provide a useful way to look at aggregate performance. The process for generating Flame Graphs for iOS/macOS is a bit janky compared to Android Studio however and external tools are necessary.
Setup External Tools
We need to setup the FlameGraph Swift command-line tool. You can either build the tool locally, or use the Mint Package Manager for Swift packages. We'll use Mint in the following example.
Skip the following steps if you have already performed them.
Install Mint
Install Mint via Brew.
brew install mint
Add the Mint bin directory to your path. The following assumes your .rc file is .profile. Adjust as necessary.
echo 'export PATH="$PATH:$HOME/.mint/bin"' >> ~/.profile
source ~/.profile
Install FlameGraph via Mint
mint install lennet/FlameGraph
Capture Profile using Instruments
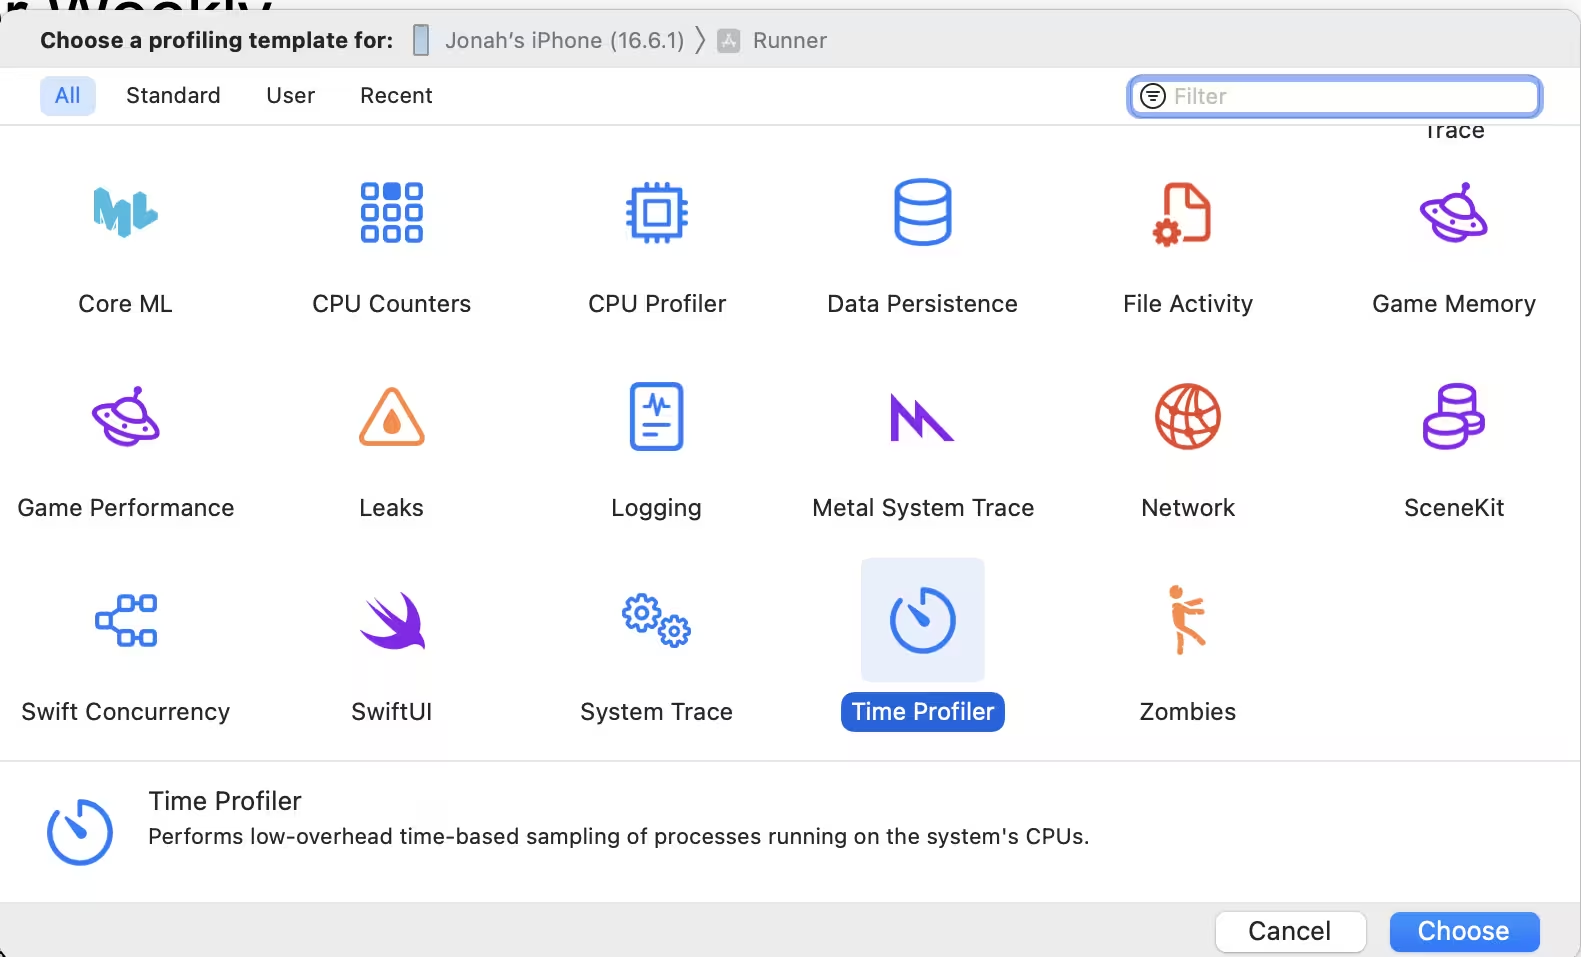
Use the Time Profiler Xcode template.
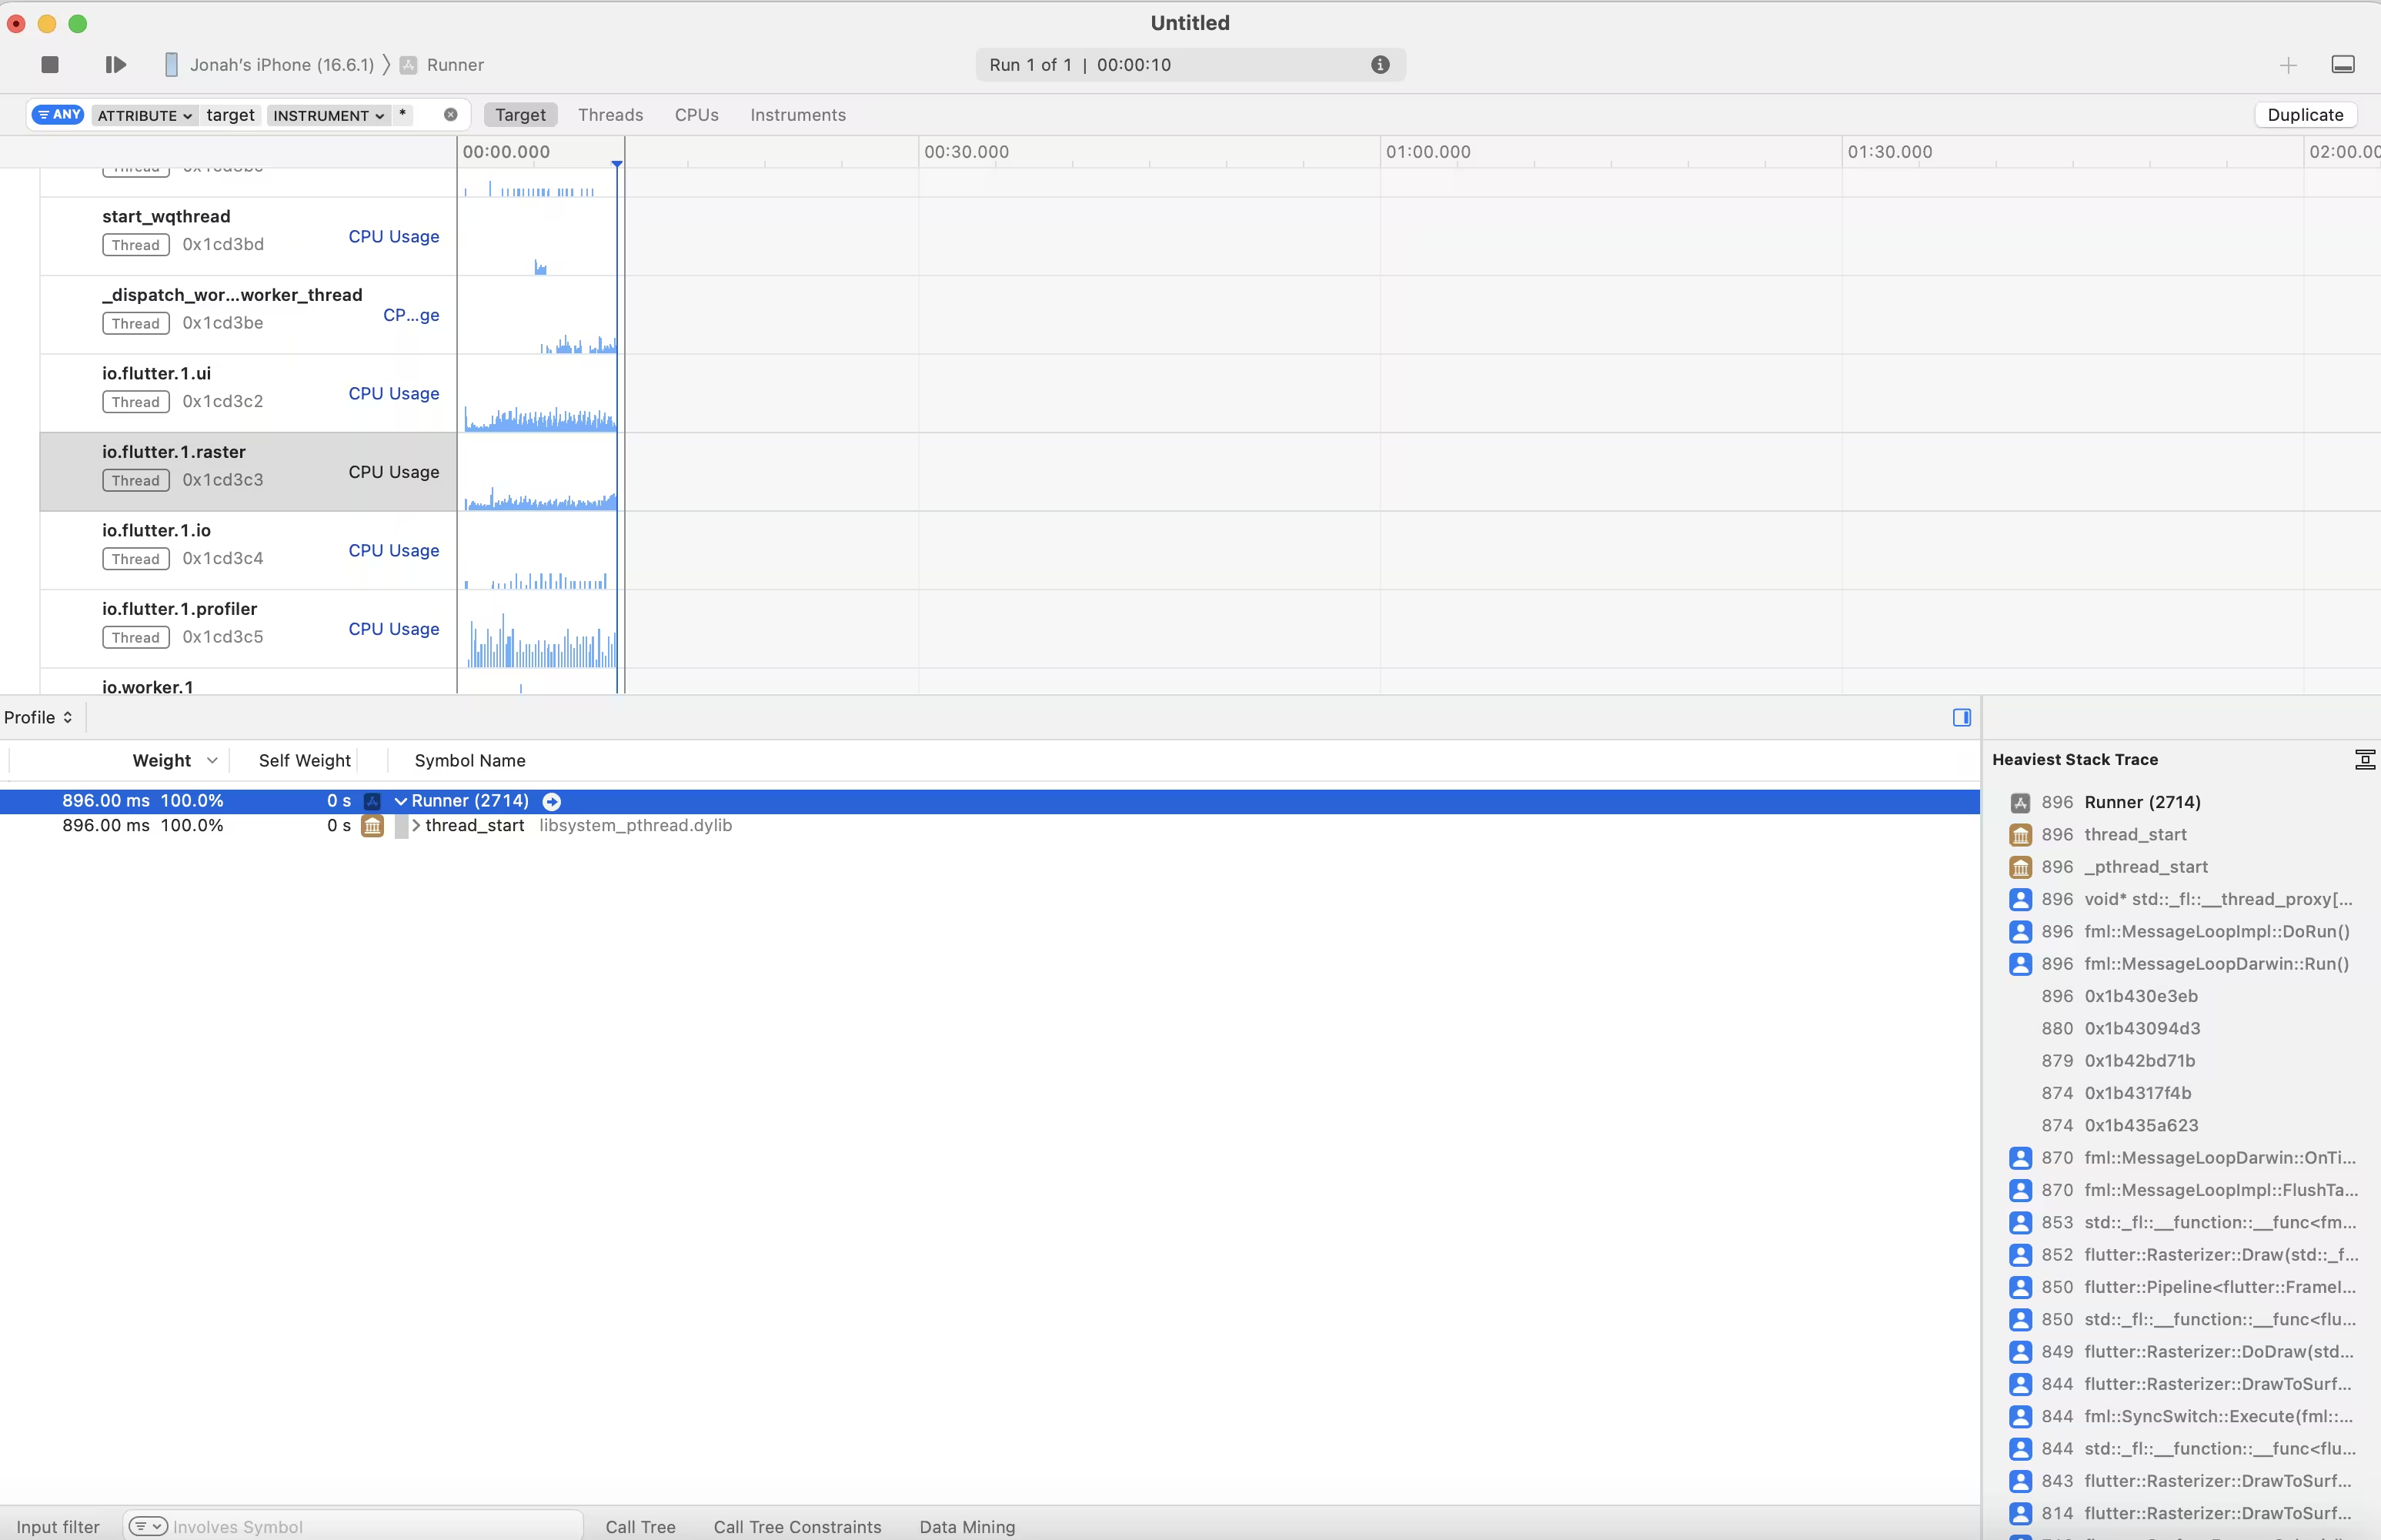
Click the red dot to begin and record as much profile data as you want. Press stop to conclude the trace.
Select the thread to investigate, in this case you want io.flutter.raster.
Important
Make sure to select the trace root.
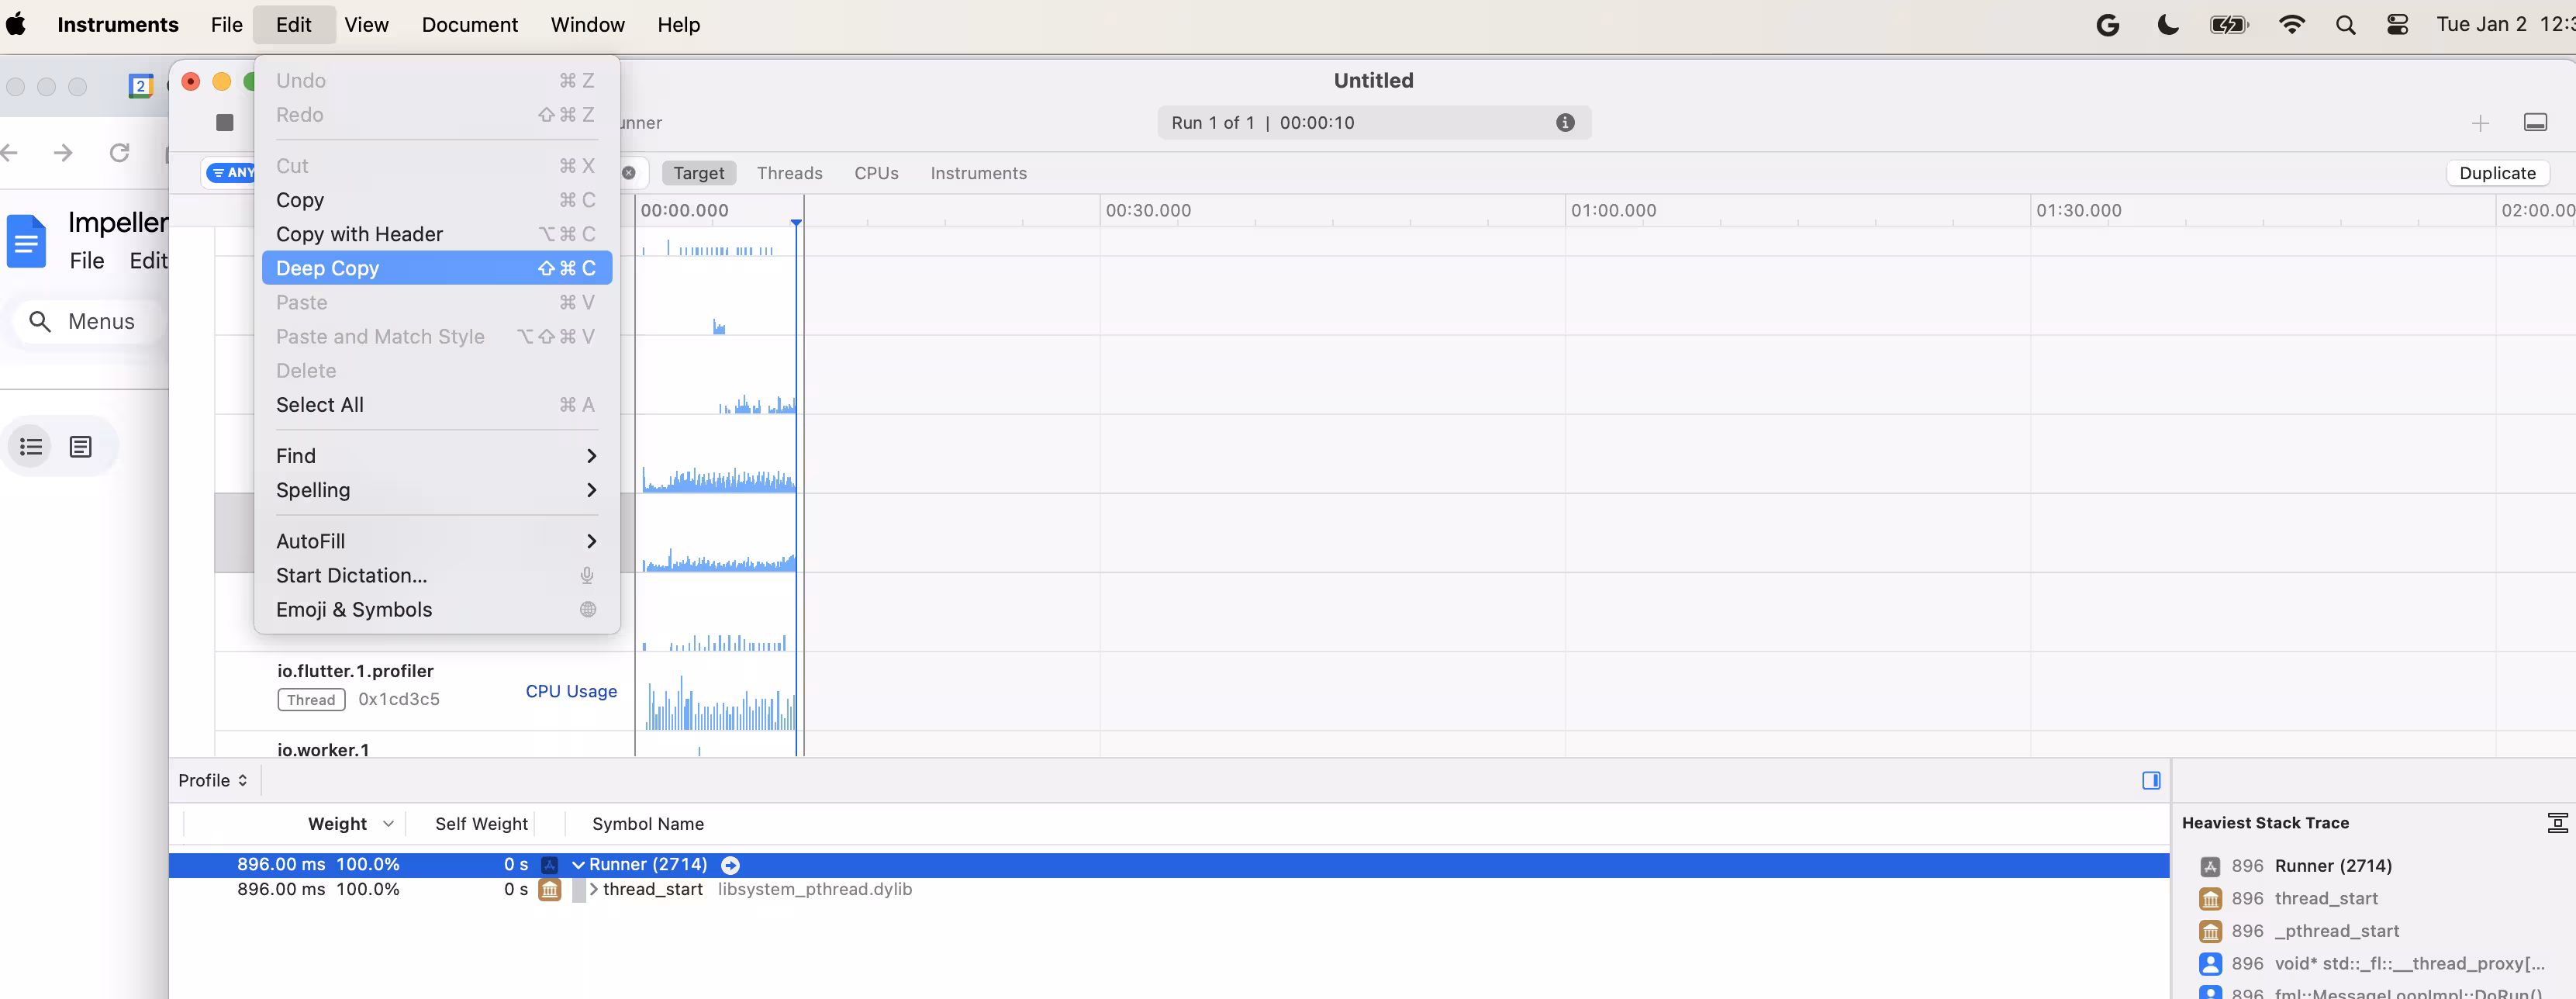
Copy the trace with the keyboard shortcut (⇧⌘C) or the menu ("Edit" -> "Deep Copy").
Convert Profile to FlameGraph
On the command line, run FlameGraph to convert the contents of the profile in your pasteboard to an HTML format.
FlameGraph --html output.html
A new browser tab will open with the Flame Graph. It may require some zooming to be useful.
